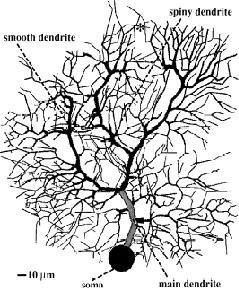
| Figure 1: | Morphology of the Purkinje cell model (cell1 of [?]). The 3 zones
with different channel densities (Table 2) are marked as soma (black), main
dendrite (dark gray), and the rest of the dendrites (black). Dashed lines:
recording sites displayed in Figs 3-7. Asterisk: recording site for Figs. 12 and
13. |