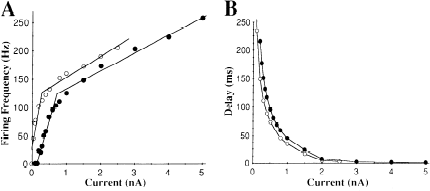
| Figure 1: | Relation of somatic firing response to the amplitude of injected
current in models PM9 (∘) and PM10 (∙). A: Firing frequency vs.
amplitude of injected current [frequency-current (f–I) curve]. Frequencies
were measured in an interval from 300 to 700 ms after onset of the current
injection, before any clear depolarizing spike bursts in the soma. B: Delay
between onset of current injection and 1st somatic spike vs. amplitude of
injected current. |